Diagrams
The basic forms of the circle and square are the starting point for our infographics. This helps us design and execute in a clear and digestible way.
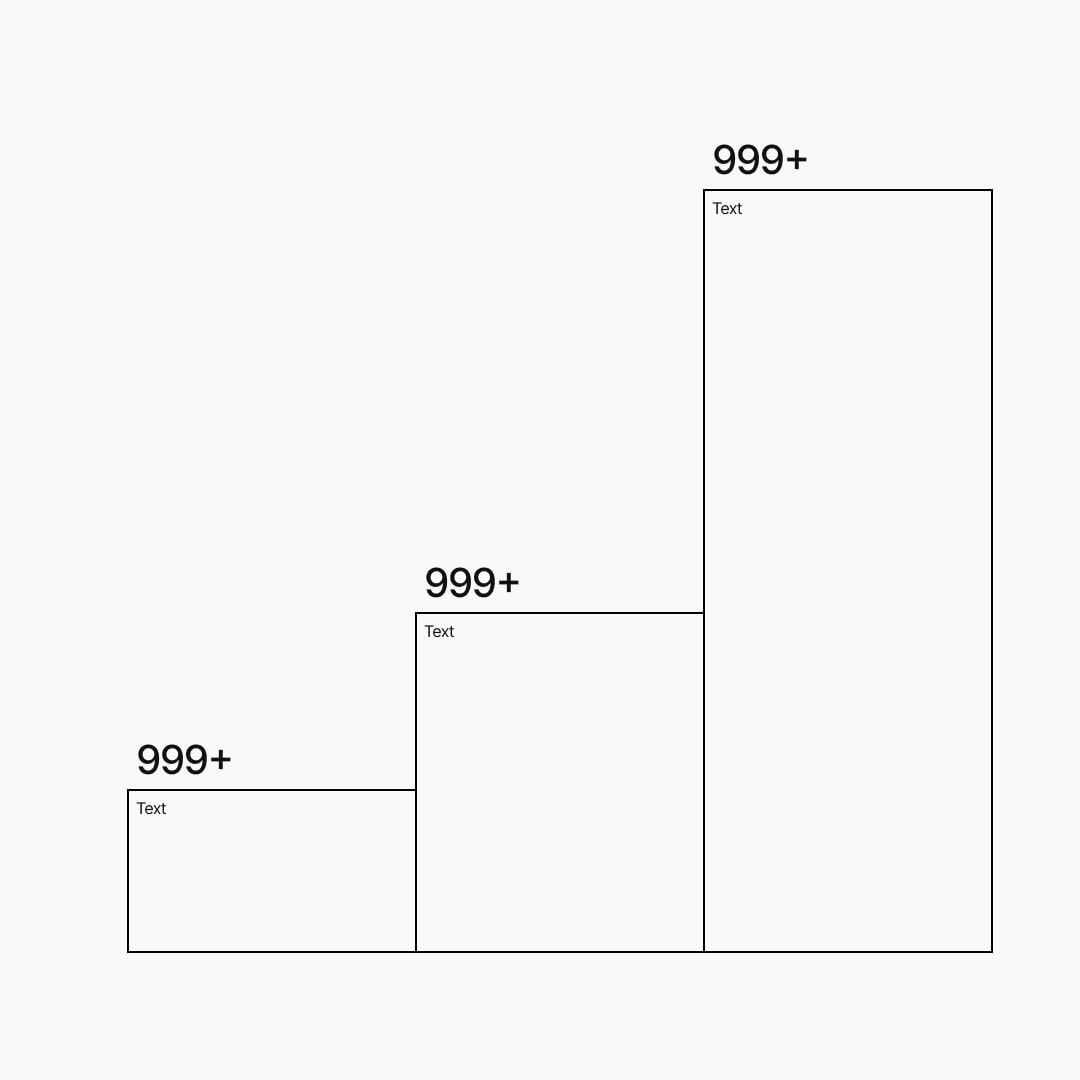
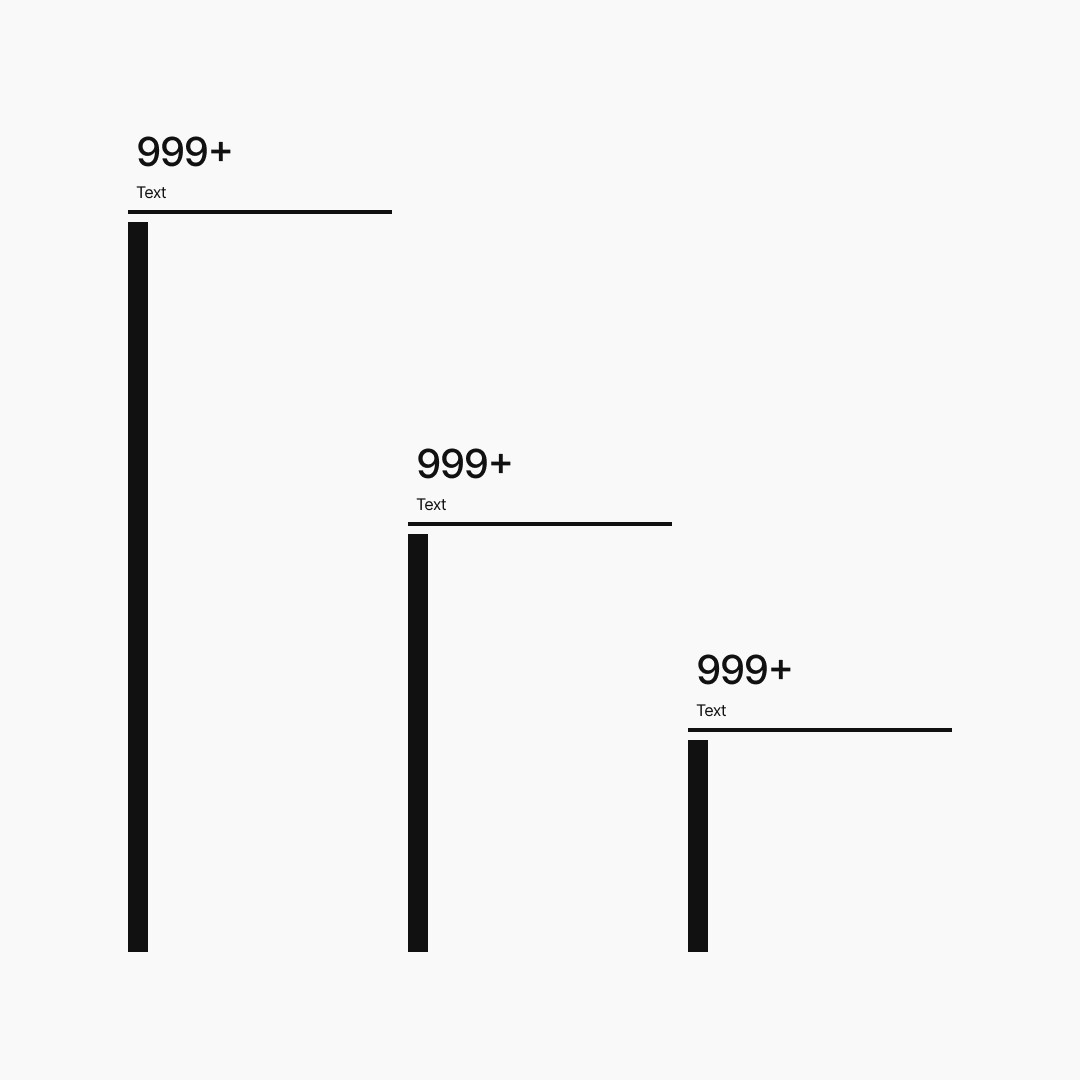
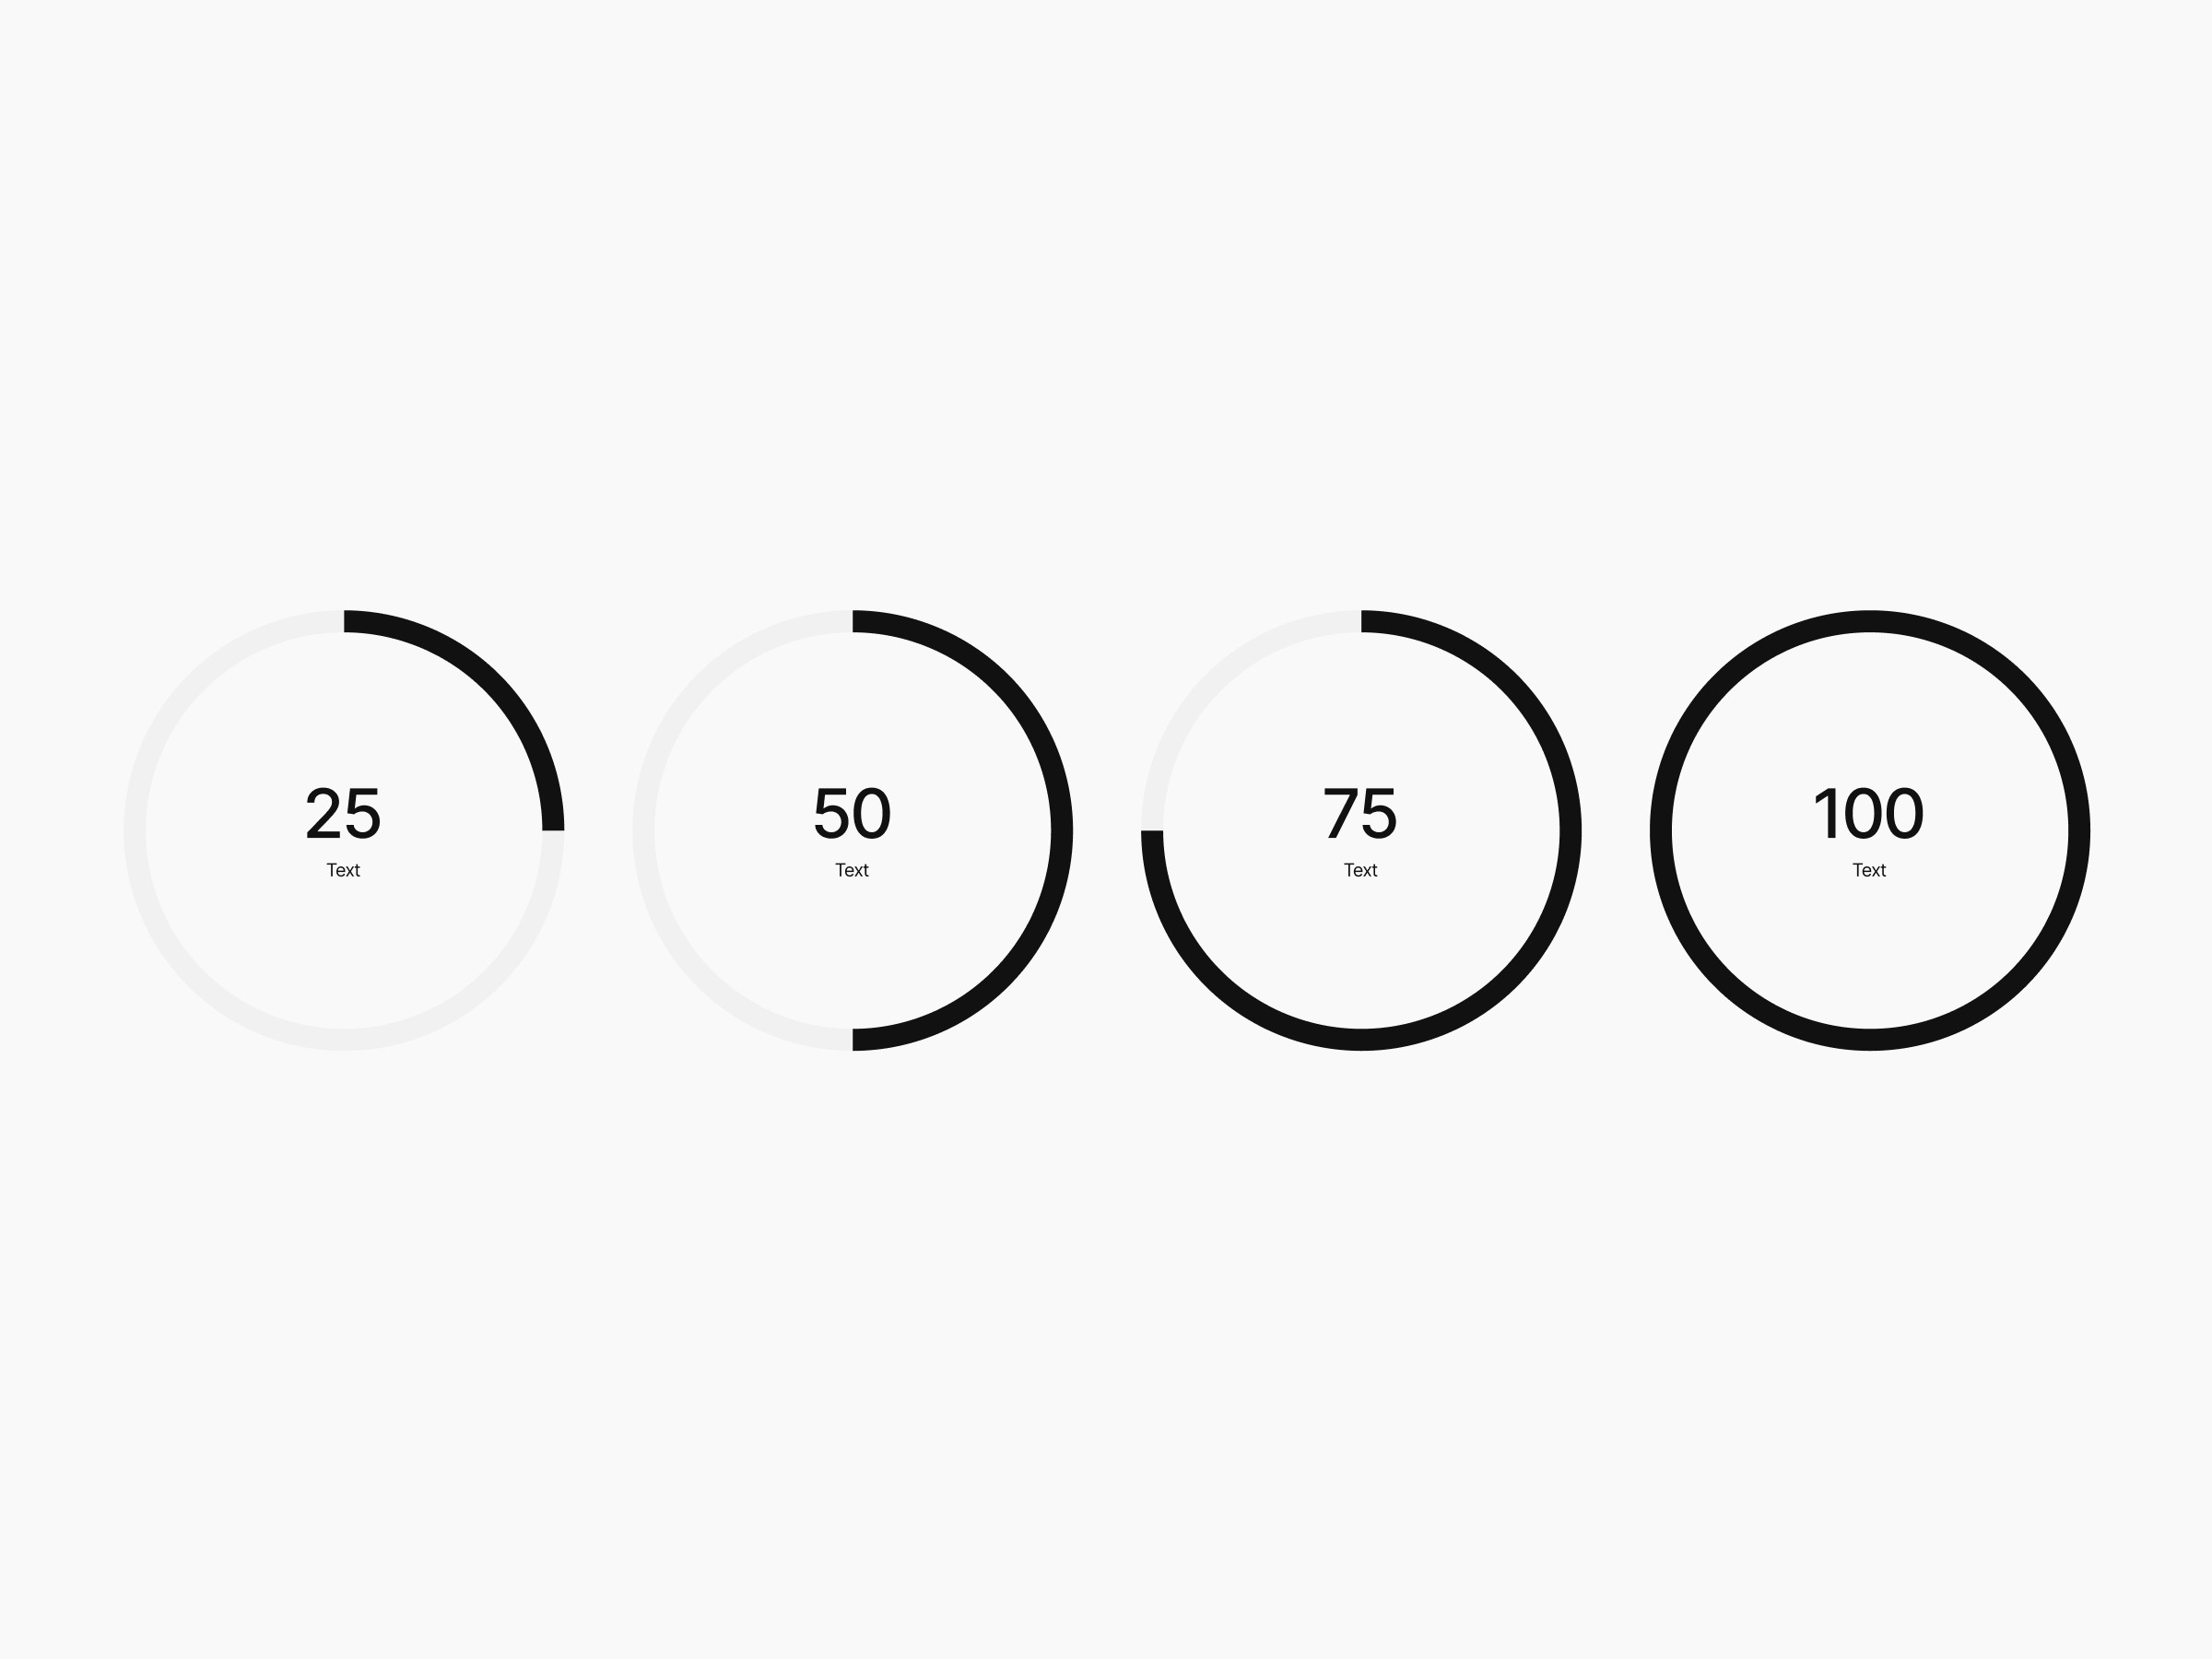
Vertical with stroke
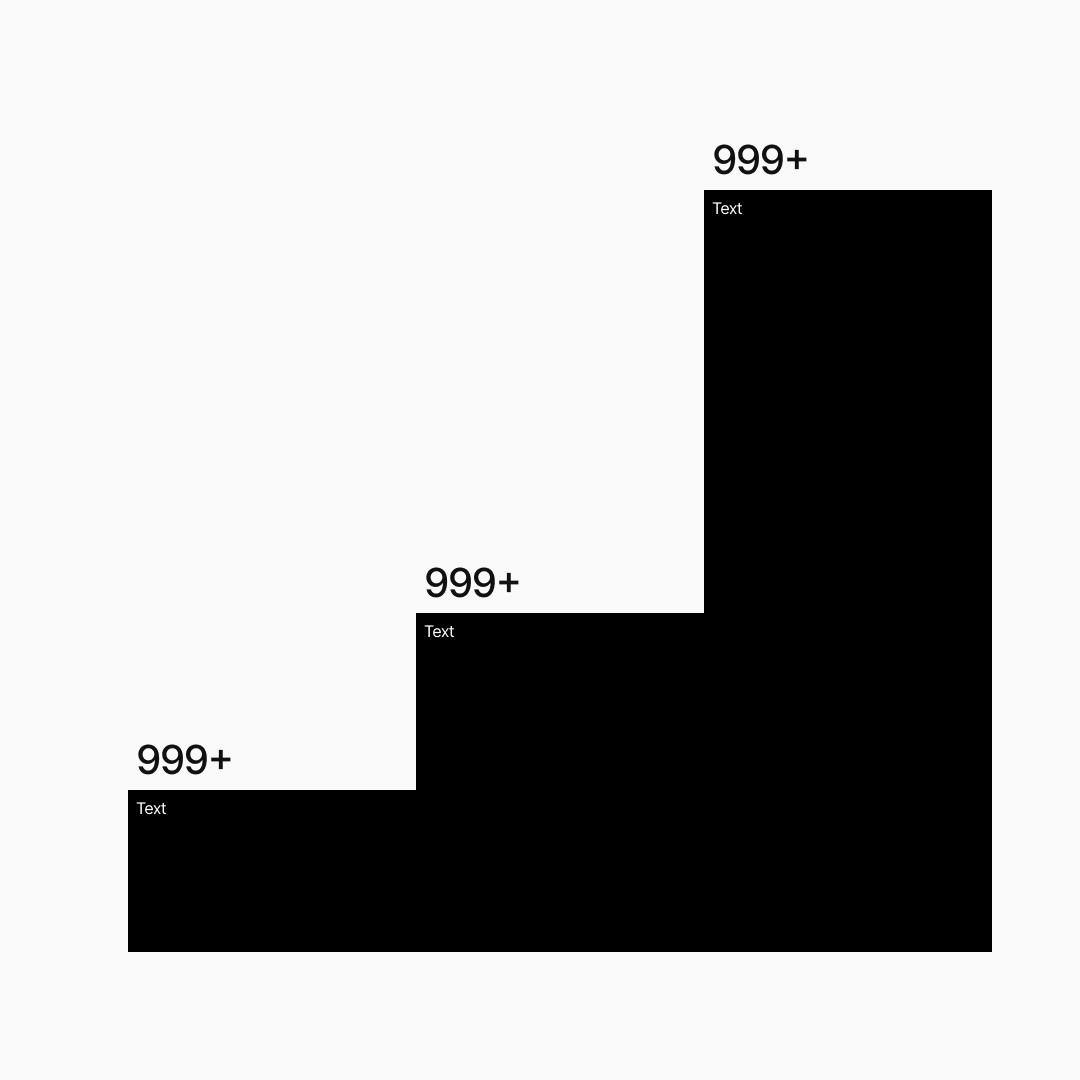
Vertical with filling
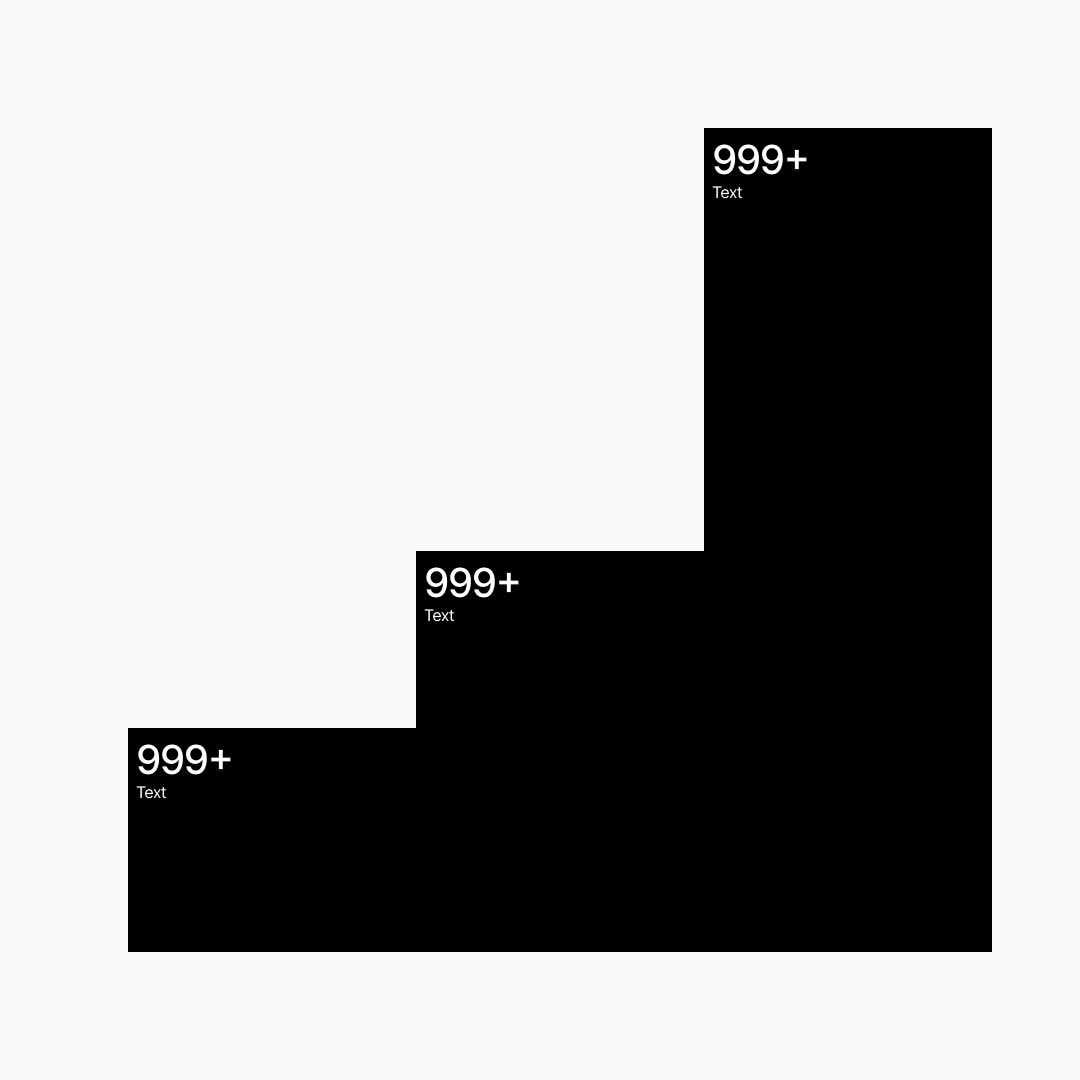
Vertical with filling
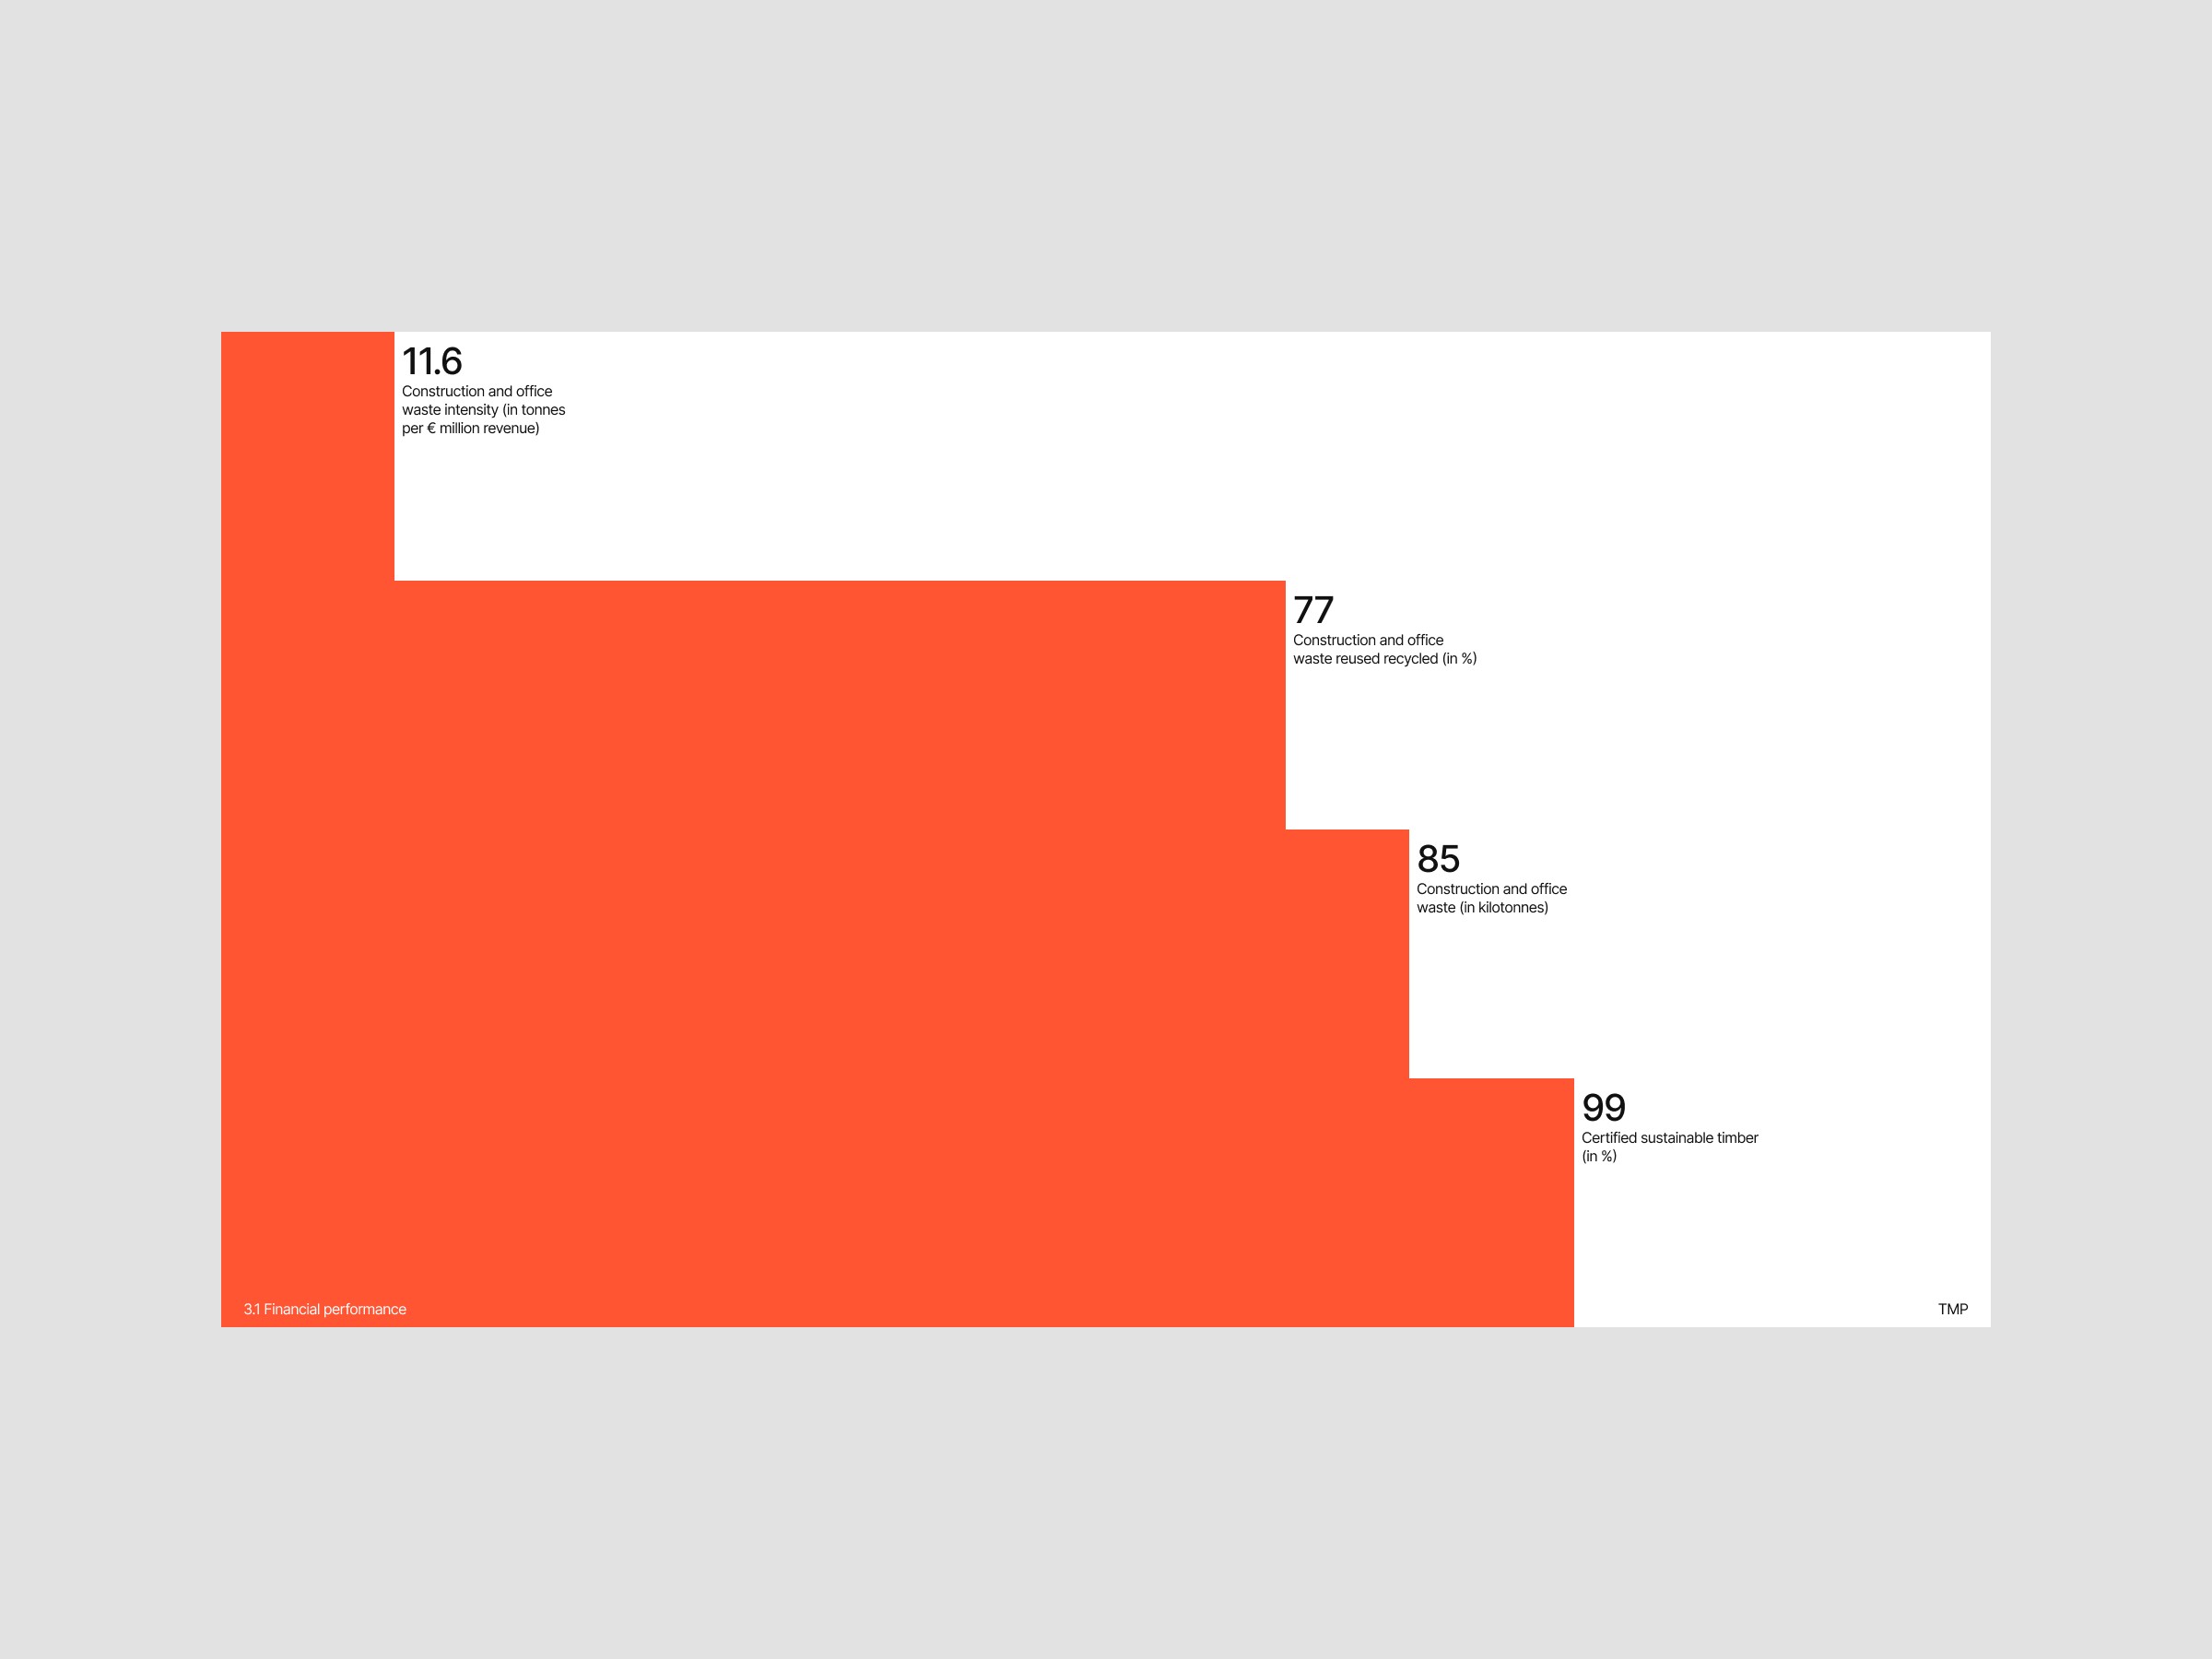
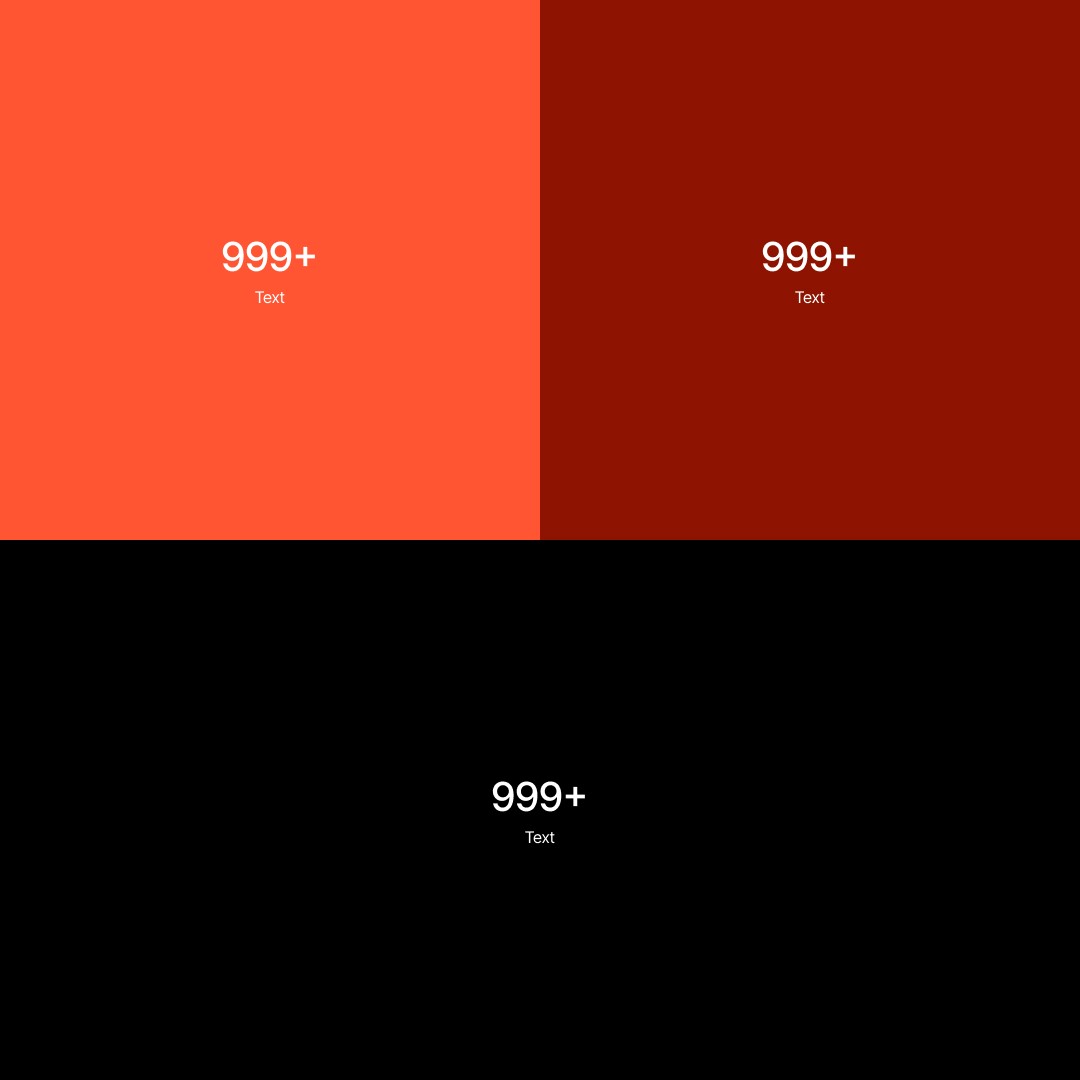
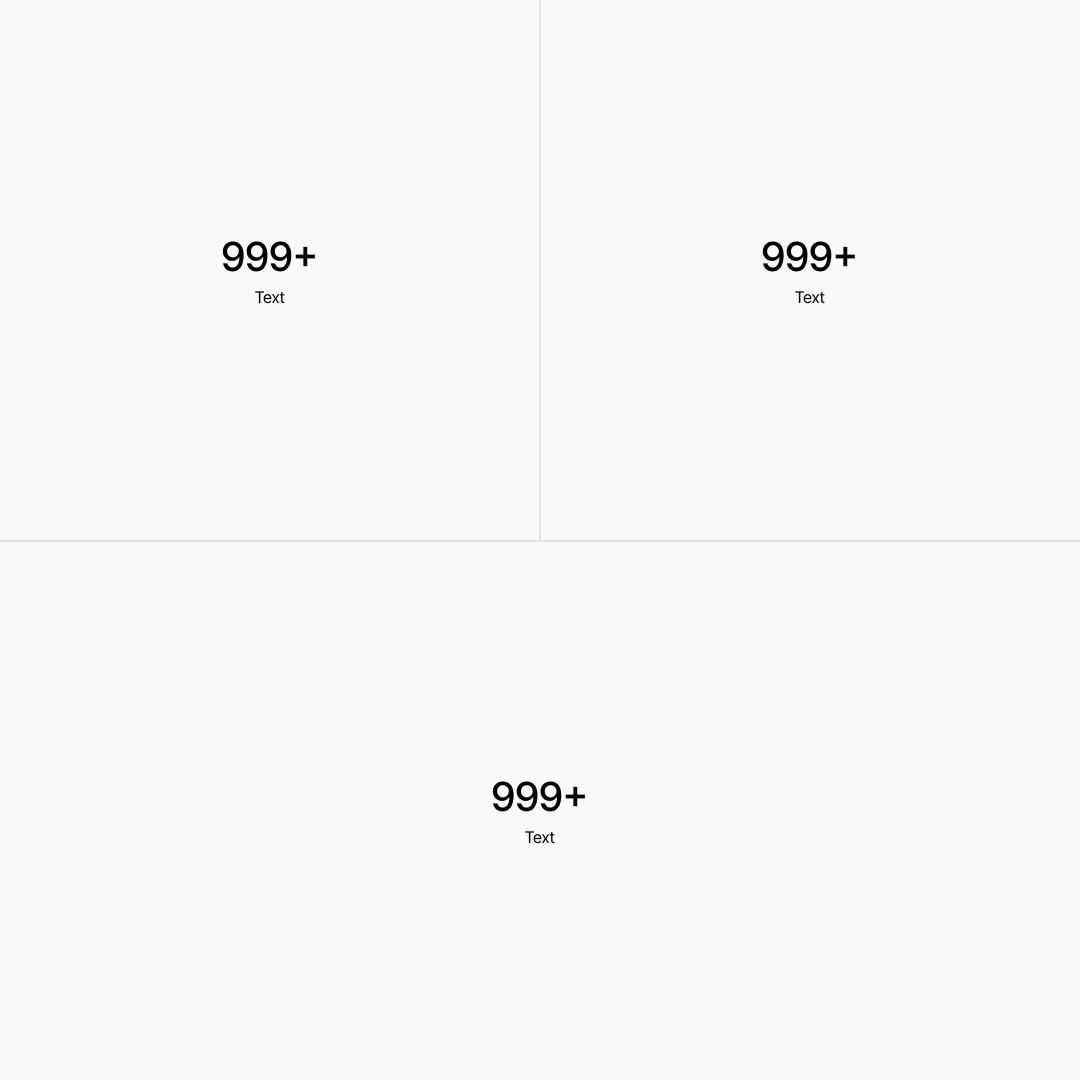
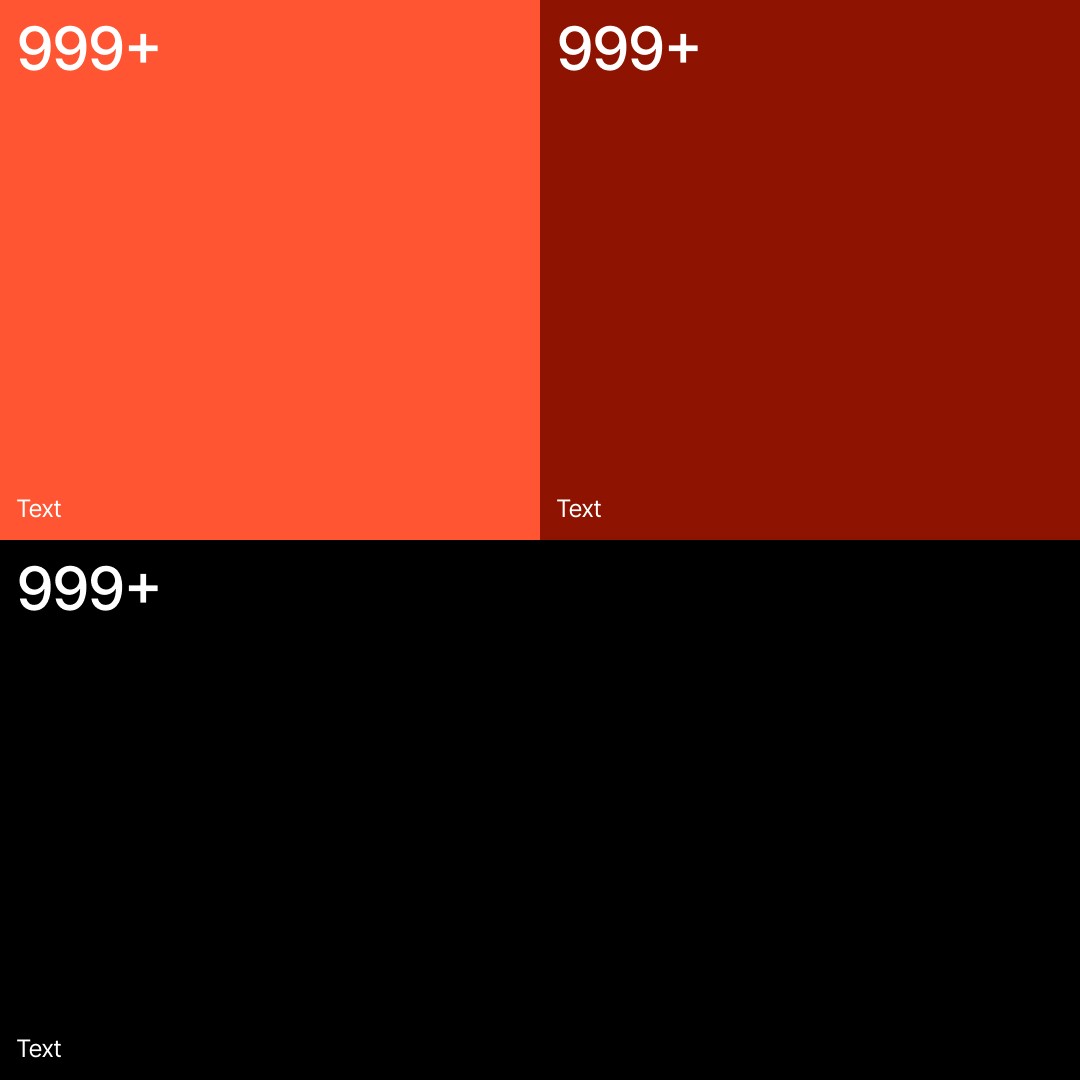
Horizontal with stroke
Horizontal with filling
Horizontal with filling
Linear v1
Linear v2
Linear v3
Combined v1
Combined v2
Combined v3
Area map
Filled
Linear
Filled
Linear
Bubbles
Filled
Linear
Circle map
Arrows / points
Simple and elegant arrows, with dot as points.
Variant 1

Variant 2